

This is 2026.9 documentation. Coverage here is incremental: a page exists only where 2026.9
differs or is newly documented. For any other topic, switch to Current (2026.8 and earlier) in
the version selector.
Speckle.GetByUrl reports can keep working when their target versions contain JSON data. To follow versions published only in the new data format, see Upgrade Power BI to 2026.9.
What changed
Speckle.GetTables accepts model, version, federated, and project URLs.
The default Simplified layout provides three Navigator entries:
- Objects has one row per object. Its standard columns are
Object Key,Application ID, andModel Info. Federated loads also includeSource Model. - Properties is a function. Pick the properties the report needs from a list, then load a table
that contains
Object Keyand those property columns. This table replaces the single flat table thatSpeckle.GetByUrlreturned. - Relations is a function. Choose outgoing graph relations such as
ON_LEVELorIN_ROOM, then load a table that containsObject Keyand those relation columns.
Object Key.
Functions
Properties and Relations are bound to the loaded model. They are not global M functions.
useFullPaths is a logical value. false uses the shortest unique suffix and true uses the full
dotted path. The connector adds numeric suffixes when names still collide at full depth.
Speckle.AddProperties and Speckle.AddAllProperties take the navigation table returned by
Speckle.GetTables as source. Their optional Objects override can filter the result and preserve
extra columns.
Speckle.Objects.* and Speckle.Models.* helpers still exist. They operate on the legacy
Speckle.GetByUrl table only. They do not accept the tables returned by Speckle.GetTables. For
the retained-function list, see Upgrade Power BI to
2026.9.
Load
1
Connect to Speckle
Select Get Data. Search for Speckle, then select Connect to Speckle (Custom) and
Connect. You should see the Speckle Model URL input.
2
Paste a Speckle URL
Paste the URL from the web app and select OK. Sign in when prompted. You should see Objects,
Properties, and Relations in Navigator.
3
Load Objects and related tables
Select Transform Data to open Power Query. Enable load for Objects. Select the Properties
function, pick the properties the report needs in the Properties list, then select OK
and Invoke to create a new query. Do the same with Relations for fields such as levels or
rooms. Enable load for the resulting tables and leave the function queries with load disabled.
After Close & Apply, create one-to-one relationships from these tables to Objects using
Object Key.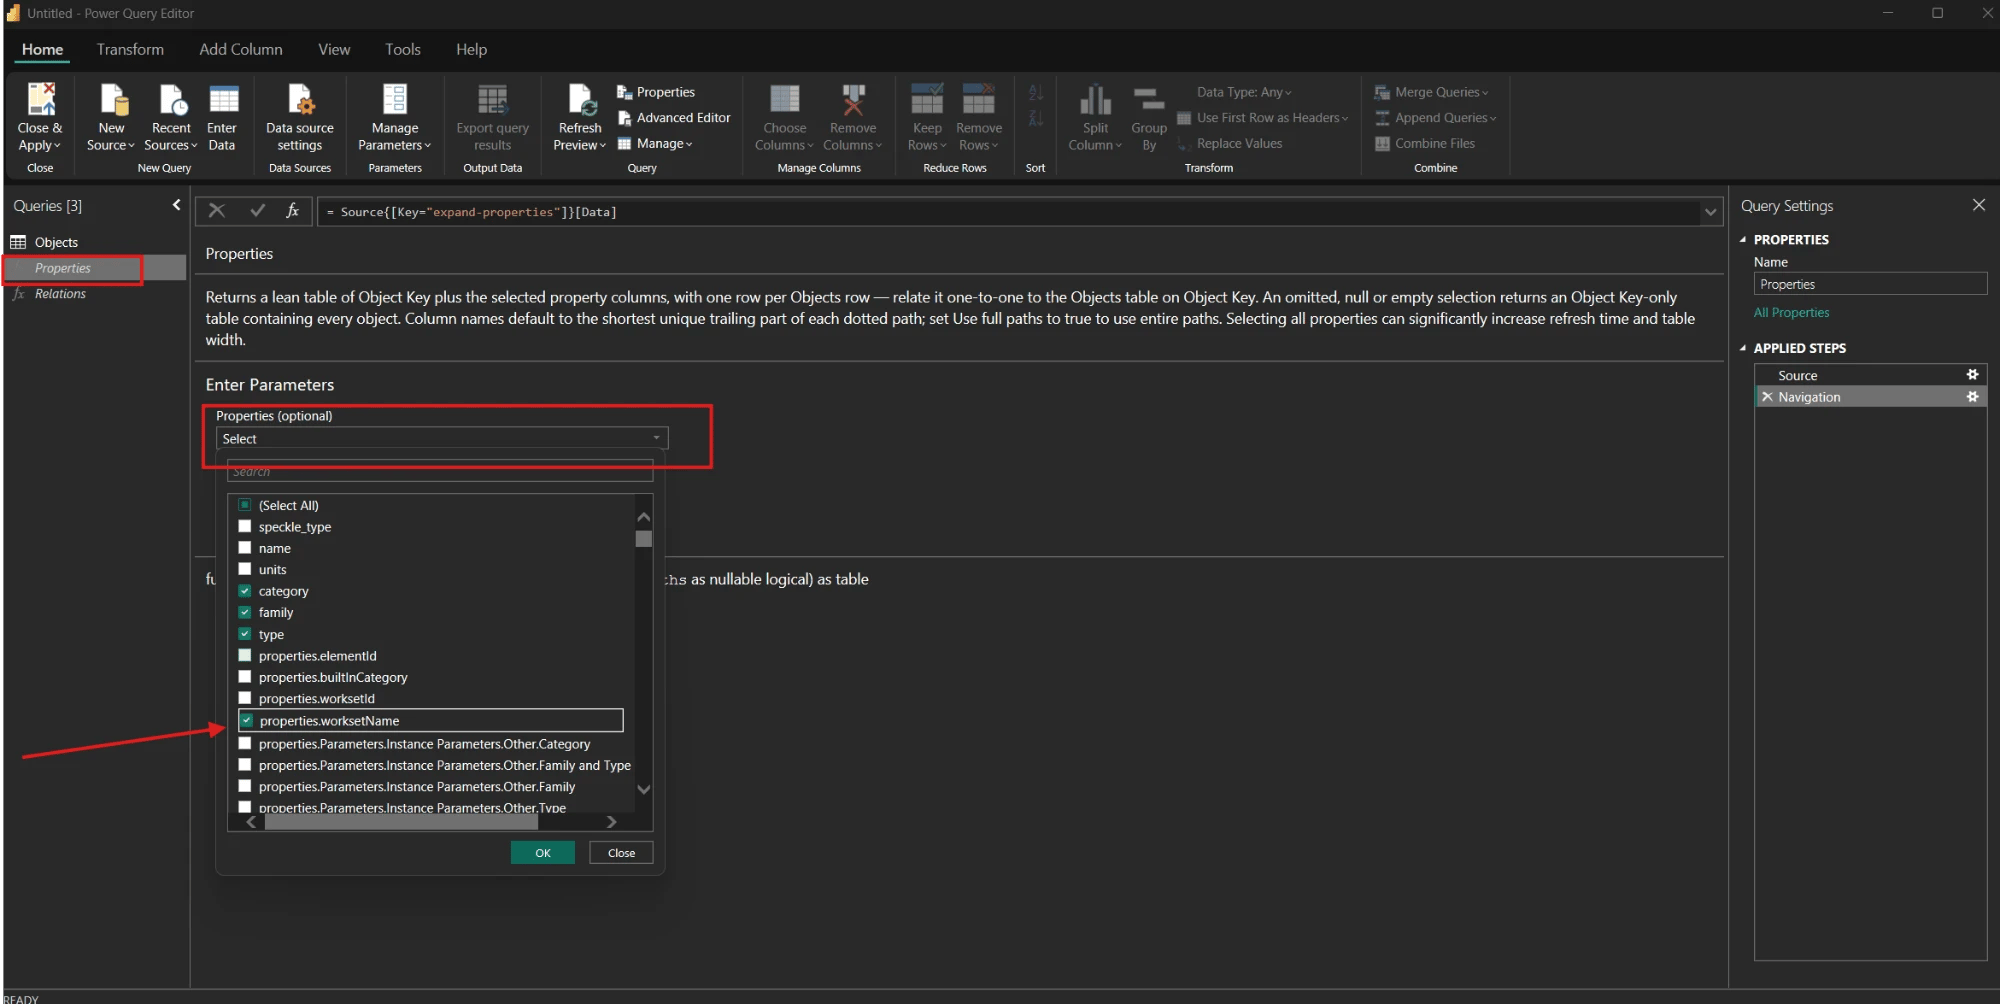
Pick properties from the list, then select OK and Invoke.
The Properties function uses the shortest unique suffix for column names by default. Set Use
full paths to
true to use full dotted paths. If two names still collide at full depth, the
connector adds numeric suffixes such as .1 and .2. Instance values use unprefixed column
names. Type values use the Type_ prefix.View
The new visual has four data fields: Model Info (required), Object Keys (required), Object Data (Tooltip), and Color By. UseObjects[Object Key] as the standard object binding. Application ID remains supported, but large models require an extra lookup dictionary that can add tens of megabytes to the load.
Geometry no longer passes through the Power BI dataset. The visual streams it from Speckle over a
WebSocket, becomes interactive after the first geometry arrives, and continues loading in the
background.
1
Import the new visual
In the Visualizations pane, select Import a visual from a file. Browse to
Documents/Power BI Desktop/Custom Visuals, select Speckle Power BI 3D Visual.pbiviz, and Open. You should
see the imported visual in the pane.2
Add the model fields
Add the imported visual to your report. Check that its fields include Object Keys. The older
visual has Object IDs. Drag
Objects[Model Info] into Model Info and Objects[Object Key] into Object Keys. Drag tooltip fields into Object Data (Tooltip) and the category
field into Color By. You should see the first geometry arrive, then the rest stream in the
background.FAQ
How do I get one table of objects and their properties, like GetByUrl returned?
How do I get one table of objects and their properties, like GetByUrl returned?
Invoke the Properties function: pick the properties you report on, select OK, then
Invoke. The result has one row per object, with
Object Key and one column per property.
For the 3D visual, also load Objects and relate it on Object Key, because Model Info lives
there. To get it all in one table in M, use Speckle.AddProperties(Source, {"path.one", "path.two"}), where Source is the Speckle.GetTables result.Should I select all properties?
Should I select all properties?
No. Models with many property sets can have hundreds of paths, and every selected path adds a
column and refresh time. Start with the properties the report uses. To add more later, edit the
invoked query’s step or invoke Properties again.
How do I find a property in the Properties list?
How do I find a property in the Properties list?
Type part of its name in the list’s search box, for example a property set name. The list shows
full dotted paths such as
properties.Quantities.Qto_SpaceBaseQuantities.NetFloorArea. The
resulting column uses the shortest unique end of the path, such as NetFloorArea, unless you
set Use full paths to true.Why don't I see Speckle - Get Tables in Get Data?
Why don't I see Speckle - Get Tables in Get Data?
Select Connect to Speckle (Custom). Power Query calls this function Speckle - Get
Tables, but Get Data uses a different label. The Speckle Model URL input still accepts
your model URL.
Why should I use Object Key instead of Application ID?
Why should I use Object Key instead of Application ID?
Object Key is the standard join and visual binding. Application ID still works, but large
models need an extra lookup dictionary that can add tens of megabytes to the load.What happens if Get Tables fails on an older version?
What happens if Get Tables fails on an older version?
GetTables reads artifact bundles. JSON-only versions published before a 4.0 connector need
Speckle.GetByUrl, or the model must be republished with a 4.0 connector.Does updating the connector update visuals already in my report?
Does updating the connector update visuals already in my report?
No. The installer copies the visual file to your Documents folder. Import that file into your
report yourself; there is no automatic update through AppSource. To move from the legacy visual
to the new one, follow the migration
steps.
What is missing from the 2026.9 3D visual?
What is missing from the 2026.9 3D visual?
Section box, view modes, edges, ghost mode, and named scene views are unavailable. Filtered-out
objects are hidden. Top, Front, Left, Back, and Right remain available. Exact minimum versions
for Speckle Server, Power BI Desktop, and WebView2 are not confirmed.
Which browsers and environments does the 3D visual support?
Which browsers and environments does the 3D visual support?
Power BI Desktop’s embedded WebView2 and Chromium-based browsers viewing Power BI Service both
support the visual. Firefox on macOS does not: it supports WebGPU, but currently allows only
eight GPU storage buffer bindings, and the visual needs nine. Other browsers on macOS allow ten
or more. Windows and Android browsers generally allow sixteen or more. This is a known, accepted
limitation. Firefox may raise the limit later.
Is ghost mode available in the 2026.9 3D visual?
Is ghost mode available in the 2026.9 3D visual?
Not yet. Filtered-out objects are hidden outright instead of shown dimmed. There is no ghost
icon or equivalent toggle in this release.
Why does geometry disappear or flicker when I zoom in?
Why does geometry disappear or flicker when I zoom in?
This is a known rendering-stability issue in the viewer, not specific to Power BI — the same
viewer now runs in the web app, the Power BI visual, and published reports. It shows up most
often with objects far from the model origin or in models with very large bounds. The fix ships
in the web viewer first, then in the following Power BI visual release, which is not on the same
cadence.